Snowflake Pipeline Efficiency: A Hygiene Framework to Cut Waste

Adapted from my theater session, Messy Pipelines Are Expensive: A Hygiene Framework for Snowflake Pipeline Efficiency, at Snowflake Summit 2026.
Why should you care about the efficiency of your data pipelines when everything looks like it is humming along fine? Your business is getting the data it needs. Dashboards load. The team ships. If you are staring at a healthy backlog and a green board, pipeline efficiency can feel like a red herring.
I care about it for one reason. Inefficiency rarely shows up alone. It travels with data quality problems, and those have been measured:
- $12.9M in average annual loss tied to poor pipeline hygiene (Gartner)
- 80% of data scientists’ time is spent on preparing and managing data for analysis (CrowdFlower)
- 31% of total revenue negatively impacted by unmonitored pipelines (Monte Carlo)
- 1 in 2 newly created records containing at least one critical error (Harvard Business Review)
These costs are also insidious. They creep in slowly. They sit undetected. And when something finally breaks, it feels like it all happened at once, even though it was building the entire time.
Table of Contents
Your Code Looks Clean. Your Engine Might Be Seizing.
On the surface, everything looks fine. Your code is DRY, your SQL is tight, you are using dbt, and your team is delivering. Under the hood, cost can drift for months without anyone noticing.
I tell my team this all the time. A car has a check engine light for a reason. That light comes on when your gas cap is loose, and it also comes on when the engine is about to seize. To get ahead of a catastrophic failure, you need the light.
Pipeline tools are great. We use them constantly. They are excellent for drying up code and understanding the structure of your models. They were not built to give you observability into how the engine is actually running. It is entirely possible, and very common, to build a clean, well-structured DAG that is costly. I have done exactly that myself.
The Visibility Gap: Your DAG Shows Structure, Not Cost
Your DAG shows you a lot. It shows dependencies between models, execution order, which models exist and how they connect, and a clear picture of your architecture. That is genuinely useful.
What it doesn’t show is cost. The DAG has no view of cost per model run, scan volume, or partition efficiency. It does not flag redundant transformations, compute waste, or how much your credits vary from one run to the next. The map of your pipeline and the invoice for your pipeline are two different documents, and most teams only ever look at the first one.
Where Data Pipeline Inefficiency Actually Shows Up
The real problems arrive at scale. Growth takes a small crack and turns it into a chasm. As teams grow, you naturally accumulate duplicated logic, overprovisioned compute, and workloads that no one needs anymore but that still run on schedule.
AI coding tools make this worse, and they do it fast. If there is one thing these tools are good at, it is scaling how much code you write. Code is becoming a commodity, so the engineering cost of repetitive or inefficient code has dropped. That same shift has moved us further from understanding what a given line of code costs once it hits production. We can measure the value of writing a line of code better than ever. We can barely see what it spends.
Two examples I run into constantly:
- An AI assistant writes a query that reuses a common table expression instead of materializing the output, so the same expensive work runs again and again.
- An engineer does not fully understand the complexity of some generated Python, so they bump up the warehouse size as a precaution and leave it there.
Let AI do its thing. Just prepare your indicators to keep it on the rails.
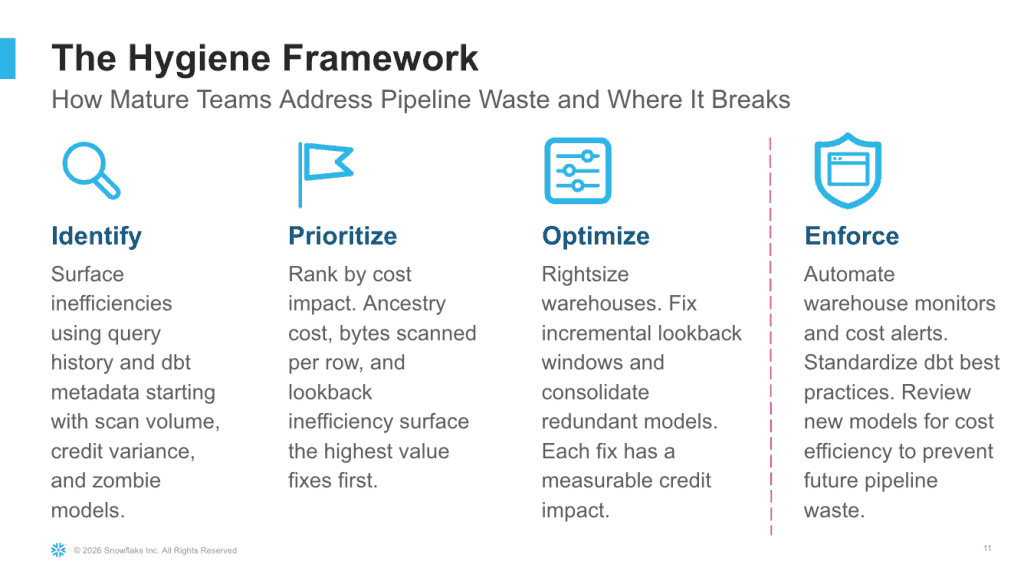
The Hygiene Framework: Identify, Prioritize, Optimize, Enforce
If you want to keep your AI agents and your over-eager engineers from getting the accountants involved, you need to mature your process. A framework I have found works has three properties.
First, it is repeatable and, ideally, automated. Remember the old engineering adage about spending 10 hours to automate a task you could have done by hand in one. This is the version of that trade that actually pays off, because you run this work forever.
Second, it covers every angle. Optimization does not work without prioritization, and prioritization does not work without identification. You have to surface the inefficiencies, rank them by cost impact, fix the highest-value ones first, and then keep them fixed.
Third, someone has to enforce it. Ongoing enforcement is what keeps the problem from growing back. This is much easier to build before cost becomes a finance conversation than after.
Enforcement Is a Culture Problem, Not a Tooling Problem
Most teams are already good at identification, prioritization, and optimization. Enforcement is the step that breaks, and it is arguably the most important one.
It breaks for three reasons. First, it makes everyone involved uncomfortable. Second, it only works if the company culture supports making mistakes and recovering from them. And third, it is not fun. Part of my job at Keebo is enforcement, and I do not enjoy knocking on someone’s door to tell them they are spending too much money.
This is hard because it is cultural, not technical. The way I deal with it is to take the awkwardness out through automation so I can spend more time on the parts of the job I actually like. If you can find an autonomous tool that removes the responsibility entirely, even better.
When I was a consultant, before mature tooling existed, I worked on projects where the architect had to periodically check the indicators on our pipelines by hand. Enforcement back then meant emails, Slack messages, and meetings. Lean into the engineering instinct to automate instead. Use Claude rules and skills, put alerts on your dashboards, and make sure your team knows the new standards. The only thing better than automation is an autonomous tool that takes the whole responsibility off your plate.
Measurement: Nine Metrics That Find Waste
You cannot enforce what you do not measure. These are the nine metrics I use, grouped into three audits. Individually each one is useful. Together they give you the check engine light your DAG never will.
Many of the metrics below are built from data Snowflake already records: QUERY_HISTORY, ACCESS_HISTORY, WAREHOUSE_METERING_HISTORY, and query tags. The work is connecting that data to your DAG and checking it continuously.
Economic Audit: Lineage and Utility
This audit finds ghost compute and luxury data that returns zero value.
1. Ancestry Cost Multiplier. This tells you how much it truly costs to produce a given output. Traverse the upstream nodes for a leaf model and sum their cost. Join QUERY_HISTORY with your dbt manifest to build it. A single dashboard table can carry a shocking amount of hidden lineage cost.
2. Zombie Models. How often does a model actually get read? If nothing has touched it in 30 days, drop it. Union QUERY_HISTORY and ACCESS_HISTORY to find the models that are still running on a schedule but serving no one.
3. Duplicate Query Patterns. Are you running the same SQL across different DAGs, or even inside the same one? These are your best candidates for materialization. Hashing the sanitized query text gives you a read on exact duplicates. Catching shared subqueries and CTEs takes more parsing, and vector similarity search is a strong option when the SQL is close but not identical.
Technical Leakage Audit: Query and Table Design
This audit finds pipelines whose query or table design makes every run cost more than it needs to.
4. Scanning Efficiency Ratio. Divide bytes scanned by rows produced. This tells you how efficiently a query generates its output. Are you scanning too many partitions? Are your joins inefficient? A bad ratio degrades query performance and increases the odds of spilling to disk, and both raise the cost of every run. Compare it within a model over time, not across models. Aggregations will always score high.
5. The Small File Problem. Sometimes auto-clustering needs a custom hand. This metric points you to the tables whose clustering needs work by looking at partition counts against storage metrics. The effect compounds across every query that touches the table. Every query that touches a poorly clustered table scans more micro-partitions than it needs to, which costs credits and time.
6. Model Cost Variance. Take the standard deviation of credits used by query tag. High variance on a model with steady input volume usually means it’s unstable. Those models usually hide dependencies, and they tend to have problems with data freshness, warehouse memory, and contention.
Infrastructure Audit: Warehouse Hygiene
This audit measures how much warehouse time goes to idle running and manual tuning, and where your auto-suspend settings can be tightened.
7. The Idle Tax. Overprovisioned auto-suspend values leave credits on the table. Underprovisioned ones cause cold starts. Compare average running time to actual vCPU usage to quantify how useful a warehouse really is, and use it alongside cost per query to tune your auto-suspend settings.
8. Idle-to-Peak Ratio. This one is Keebo’s special sauce. It gauges your effective load by measuring the gap between peak workloads and normal processing. Contention between those two states is real. Rightsizing for both is genuinely hard, and getting it wrong forces you to trade wasted credits against query performance.
9. Engineering Toil. This is the hardest metric of the set to measure and one of the most powerful. It probably means more time in Jira, and I am sorry about that. Engineers want to work on features that move the business. Grinding on maintenance and data cleanup is a reliable way to lose your best people.
Do the Next Right Thing, and Start Now
If you have kids, you have probably seen both Frozen movies a thousand times. Frozen 2 has a song about doing the next right thing, and that guidance holds up here.
You do not have to fix everything this quarter. You have to build the indicators, then start closing the gap. Three moves are worth making now.
- Kill the zombies: if a model has zero reads in 30 days, drop it and spend those credits on AI instead.
- Require a cost-per-run estimate on every new dbt pull request.
- Replace your manual cleanup sprints with autonomous hygiene that rightsizes warehouses and kills redundancy in real time.
That last move is the long game. Manual audits tend to drift as new pipelines land. Snowflake gives you the signals (budgets, resource monitors, QUERY_HISTORY), but checking every past fix against them by hand is hard to keep up.
This is the gap my team at Keebo works on. On average we cut compute waste by 27% by closing the enforcement loop automatically, which is the same loop I find the least fun to run by hand.
Whatever tools you choose, autonomous is the play that keeps everyone working efficiently without someone knocking on doors.