Snowflake Spillage: What It Is, Why It Happens, and What It Costs You


Every generation of engineers rediscovers the same basic fact: memory is fast, disks are slow, and the gap between them comes with a price. In Snowflake, that price has a name: spillage. The database literature has been quantifying exactly this trade for forty years, and your invoice is just the latest example of the problem.
I’ve written before about Snowflake pipeline efficiency, and spillage falls into a similar category. That is, it’s one of the more common sources of unnecessary Snowflake costs.
Key Takeaways
- Snowflake spillage makes the memory–disk gap costly. When a query outgrows available warehouse memory, Snowflake completes it by writing to local disk, and then to remote storage. Because warehouses bill per second, it often costs more for a query to spill over vs. scaling up a warehouse to run it faster.
- The problem is rarely a new problem in the query, but how that query performs in an ever-changing environment. Sorts, hash joins, and large aggregations cause spillage as data volumes grow. The same untouched query that fit in memory in January can quietly fall off a performance cliff by June.
- There’s no one perfect fix for this problem; dynamic environments require autonomous adjustments. Choosing between a bigger warehouse and processing less data is a break-even calculation, but its constants (data volume, skew, concurrency) drift weekly. A human can solve it once, not continuously.
Table of Contents
What Is Snowflake Spillage?
Snowflake spillage is what happens when an operator needs more working memory than the warehouse can offer. Rather than failing the query, Snowflake writes an intermediate state to the local disk and keeps going. If the local disk fills up, it writes further out, to remote cloud. Snowflake’s documentation notes that performance can degrade drastically when a warehouse runs out of memory; remote spilling is worse still.
In the SIGMOD 2016 paper describing Snowflake’s architecture, Dageville and colleagues note it has no buffer pool, and that most operators, including JOIN, GROUP BY, and SORT, can spill to disk and recurse when memory is exhausted.
Simply put, spillage can introduce additional performance and compute overhead.
Why Does Snowflake Spillage Affect Query Performance and Compute Efficiency?
Snowflake spillage causes queries to be slow and expensive for reasons unchanged since the days when we all measured main memory in megabytes. Remote object storage is even slower, as it requires a network round trip to execute.
The economics of this hierarchy were formalized before most of your data team was even born. Gray and Putzolu published the five-minute rule in 1987: a break-even calculation for when data should be held in memory versus fetched from disk. This rule was derived from nothing more than the prices of RAM and I/O. Although the constants have changed many times since, the structure of the argument has not: every byte your query spills is a byte that failed that calculation.
Snowflake adds one modern twist the 1987 authors did not have to price in: the warehouse bills every second it runs. A spilling query is a slower query, and a slower query creates a longer-running warehouse. In other words, spillage is more than just a memory or performance problem. For Snowflake users, it’s a cost efficiency consideration.
What Causes Snowflake Spillage?
Snowflake spillage can be caused by a number of triggers. Here’s the uncomfortable part: spilling is usually not a sign of a poorly written query. The operators that spill are the ones that typically do legitimate work. Sorts, hash joins, and large aggregations all hold working sets in memory, and the size of those working sets scales with the data, not with the quality of the SQL.
Graefe’s survey of query evaluation techniques, still the standard reference thirty years on, treats memory-bounded execution as the normal case, not the failure case. Algorithms are designed to degrade gracefully when memory runs out precisely because memory always eventually runs out.
This makes spillage particularly dangerous in production: it can happen even when you run perfectly written code. For example, a join that fits in memory in January meets a fact table that grew twenty percent by June. By then the same query, the same dbt model, the same green CI run, starts writing gigabytes to disk.
Nobody touched anything. The data simply changed, causing query performance to fall off a cliff.
Skew can cause the same problem even faster. If one join key has far more rows than the others, one worker can run out of memory while the rest stay mostly idle, and the query has to wait for that overloaded worker to finish paging data.
How Do I Find Spilled Bytes in Snowflake?
Like the queue tax, spillage is fully instrumented and rarely read. QUERY_HISTORY carries two columns: bytes_spilled_to_local_storage and bytes_spilled_to_remote_storage. Snowflake’s documentation provides the diagnostic query outright. This returns your ten worst offenders over the last 45 days:
SELECT query_id, SUBSTR(query_text, 1, 50) partial_query_text, user_name, warehouse_name, bytes_spilled_to_local_storage, bytes_spilled_to_remote_storage FROM snowflake.account_usage.query_history WHERE (bytes_spilled_to_local_storage > 0 OR bytes_spilled_to_remote_storage > 0) AND start_time::date > dateadd('days', -45, current_date) ORDER BY bytes_spilled_to_remote_storage DESC, bytes_spilled_to_local_storage DESC LIMIT 10;Once you have the results, read the two columns as separate instruments:
- Local spill: the working set exceeded memory, which means you’re paying a disk penalty measured in seconds.
- Remote spill: the working set exceeds the node’s local disk, and you are paying a network penalty measured in minutes.
A little local spill on a big batch job is often an acceptable trade. Recurring remote spill on anything eats through credits fast enough that it’s not much different from setting money on fire.
Should I Use a Bigger Warehouse to Fix Spillage?
Short answer: it depends.
Snowflake’s documentation offers two remedies for spillage: 1) use a larger warehouse or 2) process less data at once. The second is free and I recommend you always try it first.
But you shouldn’t balk at using a larger warehouse either. Users who hesitate to solve spillage by adjusting their warehouse size often get the arithmetic wrong, in both directions. Each warehouse size doubles the credit rate, so upsizing to eliminate spill sounds expensive. But a query that spends most of its runtime waiting on disk can finish more than twice as fast with adequate memory. Although it’s counterintuitive, the bigger warehouse can often be the cheaper one. The reverse is equally true: a warehouse sized for a workload that has since changed may be providing more capacity than the workload now requires.
There is a third option for the memory-bound edge cases: Snowpark-optimized warehouses, which provide up to 16x memory per node at a higher credit rate. For a workload that spills heavily but does not need more CPU, paying for memory instead of a full size-up can be the better trade.
But there’s a challenge with all three of these approaches. Think back to Gray and Putzolu’s framework. They could publish their break-even as a rule because its constants, the prices of RAM and disk, moved slowly enough to revisit once a decade. The constants under your version of the equation are far more dynamic. They often include data volume, key skew, and concurrency. What’s more, they move weekly (if not more frequently).
A human can solve this equation correctly once, maybe twice. A human cannot keep solving it indefinitely over time. That is not a criticism of your team. It’s simply an observation about the cadence of the problem, and it is the strongest argument I know for making the response autonomous rather than manual.
This is also where spillage and the queue tax compound each other. A spilling query occupies its warehouse longer, which is exactly how queues form, and a queue pushes more concurrent work onto the same memory, which is exactly how the next query starts spilling. The two costs create one feedback loop viewed from different columns of QUERY_HISTORY. An autonomous controller sees the loop as one signal. A human on a quarterly cleanup sprint sees two unrelated tickets.
How Do I Minimize Snowflake Spillage?
- Compute your spill ratio. Sum both spill columns by warehouse over 45 days and divide by bytes scanned. Anything with recurring remote spill goes to the top of the fix list, no further analysis required.
- Run the break-even test on your worst offender. Take the top spilling query, run it one warehouse size up, and compare cost per run, not cost per second. The result surprises people in both directions, which is why I highly encourage you to run it.
- Then ask who re-runs experiments one and two next week, and the week after that. Because the honest answer is nobody. The break-even point moves every time your data grows, your skew shifts, or your workload mix changes, and the optimization decision that was appropriate in January may no longer be optimal by June.
That last point is the gap my team at Keebo is focused on closing: autonomous optimization that treats spill and queue signals as one problem, re-solves the trade continuously as the workload drifts, and adjusts warehouse sizing before the cliff instead of after the invoice. The experiments above are worth an afternoon. The point of autonomy is that nobody has to find that afternoon again.
The literature settled the theory in 1987. Your account settled the constants last month. The only open question is whether anyone on your team is doing the arithmetic.
Keep warehouse performance and compute efficiency aligned as your workloads change. Let Keebo continuously optimize warehouse sizing as your needs evolve.
FAQs on Snowflake Spillage
How Do I See Spillage in the Snowflake Query Profile?
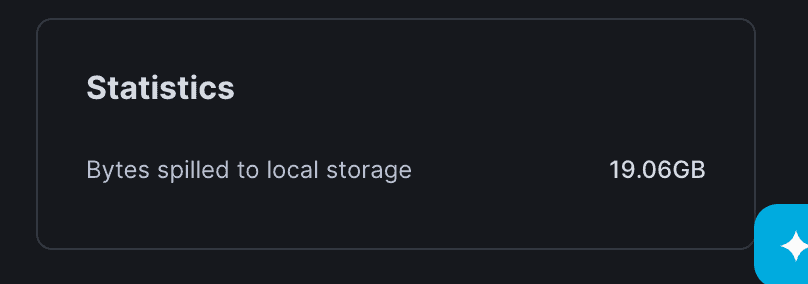
Open the query in Snowflake’s Query Profile and read the Statistics pane: when an operator has spilled, it reports Bytes spilled to local storage and, if the spill went further, Bytes spilled to remote storage. The account_usage query above tells you which queries spill across your account; the Query Profile tells you where inside a single query it happens: which operator, which step. For a large multi-step query you may have to click through the steps to find the operator holding the working set. If most of a step’s time is disk I/O rather than processing, the profile is telling you the query is bottlenecked on the spill, not the compute. We walk through reading a profile end to end in our guide to the Snowflake Query Profile.
How Do I Reduce Spillage Without Using a Bigger Warehouse?
Start by giving the query less information to hold in memory at once. Snowflake’s own guidance is to try this before sizing up, because it’s free. Filter rows as early as possible so the JOIN and SORT inputs are smaller; project only the columns you actually need, since Snowflake spills whole rows; add a LIMIT where the logic only needs the top rows, which Snowflake can push down to prune the sorted set; split large batch jobs into smaller passes; and materialize an oversized intermediate CTE into a temporary table so each step’s working set is bounded instead of forcing the whole chain to resolve in memory.
Does Snowflake Spill Rows or Columns?
Snowflake spills rows, not columns. When an operator exhausts its memory it writes whole intermediate rows to local disk, and then to remote storage if local fills. This is why wide rows carry a penalty: a table with many columns, or with large text or VARIANT columns, spills more for the same row count. It’s also why projecting only the columns you need is one of the cheapest ways to cut spill: fewer columns per row means fewer bytes to write and read back.