If optimizing Snowflake costs and performance is a top priority in 2025, Snowflake Query Profile can help you achieve those goals. Let’s walk through the tool, its capabilities, real-world usage examples, and functionality gaps.
What is Snowflake Query Profile?
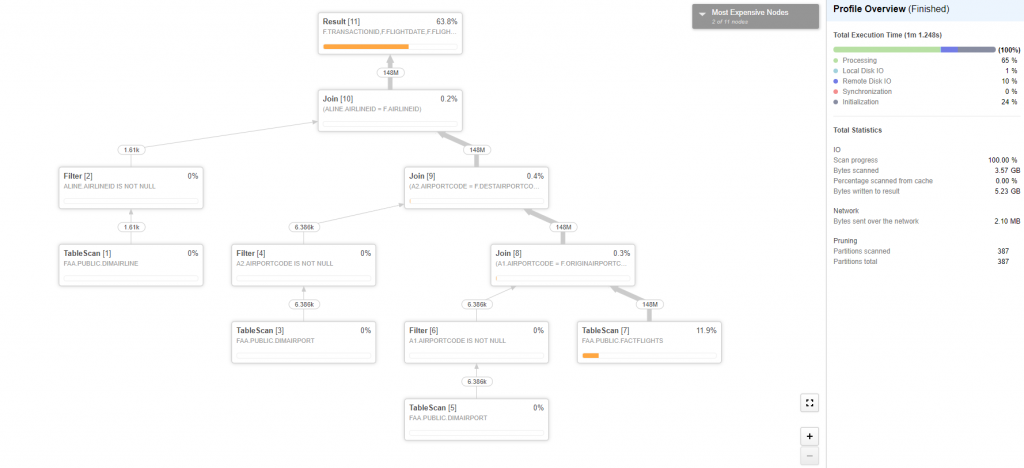
Snowflake’s Query Profile is a visualization tool that provides detailed information on how specific queries are executed. Snowflake generates this profile automatically after the execution of every query, allowing DBAs and engineers granular insight into its performance. Information contained within Snowflake Query Profile include:
- Query metadata. Query ID, Session ID, and Query Tag.
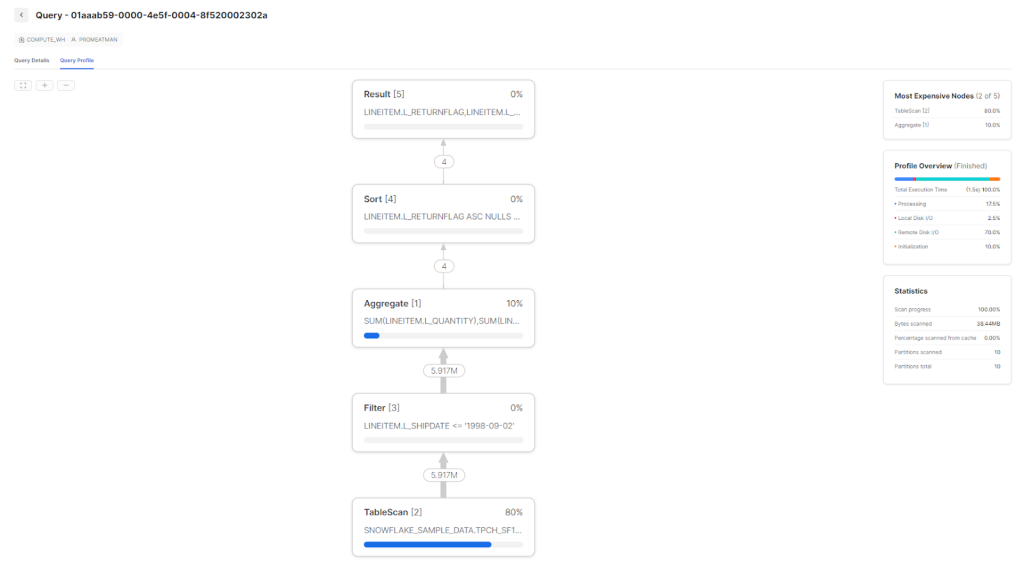
- Query execution plan. A visual graph showing the sequence and structure of operations (or nodes) that were performed during the query’s execution.
- Execution statistics. These are the metrics illustrating the nature and scope of each operation, including the number of rows processed, data scanned, and execution time (both for each step and for the overall query). This information also shows how many micro-partitions were scanned out of the total available.
- Resource usage. This gives you insights into CPU processing, disk I/O, synchronization and initialization, network transfer, and more.
- Warehouse and user details. Information on the warehouse and users who executed the query.
- Error and warning messages. Any errors or warnings encountered during query execution.
- SQL text. The SQL statement that was executed.
- Results. If the query was successful, you’ll be able to see the first 10,000 rows of results within the UI.

Why do engineers & DBAs use Snowflake Query Profile?
Engineers & DBAs use Snowflake Query Profile to better understand individual query behavior, including its impact on cost and performance:
- Identifying query bottlenecks and pinpointing which stages or operators consume the most time and resources
- Visualizing Snowflake query execution—including the order of operations and data flow—to troubleshoot issues
- Reviewing execution statistics and operator details to make targeted improvements (e.g. optimizing joins, reducing data scans, adjusting warehouse size)
- Analyzing resource use to see which resources are being used for certain queries, which can help with cost management and infrastructure planning
- Comparing query versions to determine whether a change improved or degraded performance
- Conduct programmatic analysis of query profiles at scale, identifying patterns and recurring issues across queries
Rather than relying on guesswork to determine why an individual query is slow, Snowflake Query Profile helps DBAs and engineers understand the exact source of the bottleneck.
Snowflake Query Profile examples
Snowflake Query Profile has a diverse range of use cases. To illustrate the various ways DBAs and engineers use it to find performance lags or resource-heavy queries, let’s look at three specific examples of the tool in action.
Example #1: Identifying spillage
When a warehouse runs out of memory during query execution, Snowflake will temporarily write data to a local storage disk or remote cloud storage. This is what’s called spillage, and it can significantly degrade performance. But because spillage isn’t technically an issue with the query logic itself—rather, it’s a consequence of compute setup—it can be difficult to identify just by reading the query’s SQL code.
In Snowflake Query Profile, you can measure spill-to-disk as time in local disk I/O (e.g. reading from storage). Additionally, you should be able to easily see the difference between spilled bytes and memory in the Statistics pane.
For example, you may find that 70% of the time was spent on remote disk I/O vs. 20% on CPU processing. This would suggest that the query scanned a lot of data from storage, which is a likely culprit of the lengthy execution time.

Once you verify that spillage is the cost of your cost overages or performance degradation, you’ll be positioned to address the problem. For example, you can implement autonomous warehouse optimization tools to scale up warehouses when resource demands increase, and scale them back down when they decrease.
Example #2: Per-operator Metrics
At the risk of rehashing “SQL 101,” Snowflake queries are structured as a series of operators which correspond to a specific operation that processes a set of rows. Examples of operators include TABLESCAN, FILTER, JOIN, SORT, etc.
When optimizing query performance, one option is to look at how the query is written, and to optimize the query itself. (Note that this option won’t work for auto-generated queries.) However, most queries use a series of operators in tandem. If you’re only looking at the query’s SQL code, it can be difficult to know where the inefficiencies are happening.
Snowflake Query Profile addresses this problem by visualizing each operator in a query through a series of “nodes.” By selecting an operator node, you can inspect the detailed statistics for that step: number of rows input vs. output, bytes processed, memory used, etc. These can provide valuable insights for targeted query optimization in the future.

Example #3: Query troubleshooting
In Snowflake, performance degradation is a leading indicator of a problem. It doesn’t actually tell you the root cause of the issue. Snowflake Query Profile, although not as robust as other Snowflake observability platforms, can surface any errors or performance warnings that occurred when the query was executed.
Snowflake Query profile provides a comprehensive report of execution timelines, data volumes, and resource utilization at every step, in addition to its visual representation of your data pipeline. This level of detail enables users to pinpoint inefficiencies, optimize query structure, and troubleshoot performance issues effectively.
The drawbacks of using Snowflake Query Profile to optimize cost and performance
Although Snowflake Query Profile is a helpful tool, it has some drawbacks that hinder its effectiveness at optimizing Snowflake cost and performance. Here are some of the gaps in the tool that you’ll want to fill with another option.
Non-autonomous monitoring
Although Snowflake Query Profile surfaces comprehensive insights, it does not autonomously monitor queries and take action to address them. For the tool to be effective, a human DBA, analyst, or engineer has to examine each query individually to find the cause of the performance or cost issue. Then, that engineer has to come up with a solution and get the entire team to implement it.
What’s more, the Query Profile only highlights problems. It’s up to the individual using it to determine who to solve them. So the tool’s effectiveness is highly dependent on individual capabilities.
Non-proactive insights
On top of that, Snowflake Query Profile doesn’t look for problems. If an engineer or analyst isn’t looking for the problem, the tool does nothing to tell them about it.
For example, a common scenario among new Snowflake users is that they start using the platform and don’t realize how many resources they’re consuming—until that first Snowflake bill comes in. At that point, the credits are used up, the money spent. And in many cases, they still don’t know what caused the problem.
The point is that even with Snowflake Query Profile, if you don’t know to look for a problem, you won’t find it. Only with proactive insights that look for potential problems and recommend solutions—like Keebo Workload Intelligence—can you start to get your usage under control.
Cost proxies, not actual credits consumed
If you’re relying on Snowflake Query Profile to help keep your costs under control, one of the major drawbacks is that there’s no indication of how many credits a given query consumes. You can certainly track metrics that serve as proxies for cost: bytes scanned, partitions scanned, memory/disk usage, execution time, and more. But actual cost tracking isn’t included.
If you want a more effective way of tracking Snowflake costs, Keebo’s FinOps and observability solution is your best bet. Our workload intelligence tool enables you to:
- Gain instant visibility into spend, with granular cost attribution (user, team, workload, query)
- Real-time monitoring of queries, storage & warehouses and autonomous identification of wasted storage & compute
- Proactive alerts to performance and efficiency issues with Instant recommendations to optimize spend & performance
- Customized dashboards, alerts, and financial reports to proactively manage budgets & optimize credits/contracts
Learn more about Keebo’s comprehensive workload intelligence for Snowflake here:


