3 Ways to Speed Up Looker Dashboards

Slow dashboards make for a poor user experience. While there are basic approaches to speed-up Looker, advances in AI solve the problems while taking this burden off your data team.

Updated September 5, 2023

As a computer science professor focused on database systems (and now CEO of Keebo, a data learning platform), Looker’s in-database architecture has always resonated with me. It’s exactly what we teach as best practice in database classes: push your computation to where your data lives!

Looker Live Connection Mode

This approach, known as “live connection mode,” improves security and eliminates the need for repetitive and expensive data extracts. It lets users see fresh data while enabling them to seamlessly drill down to granular details with fewer chances of seeing inconsistent numbers. Yet, despite its many advantages, this approach comes with one important tradeoff: slower dashboards.

Each time you load a dashboard or change a filter, you’re sending a new query to the database. This means waiting for:

  1. Your database to run the query (Snowflake, Redshift, BigQuery, etc)
  2. The network round-trip time for the request and the results
  3. Looker’s own time to render the new results.

If your dashboard has 5-10 tiles, then you have to wait for your database to finish running 5-10 of those queries. So you can easily end up looking at spinning wheels for 15-60 seconds waiting, depending on the complexity of your dashboard. It gets even worse if you’re at a company with concurrent dashboard users.

Looker spinning wheels

The problem with slow dashboards

While 15-60 seconds may not seem like a lot of time, it discourages exploration of interesting patterns and decreases the frequency of “going to the data.” User experience studies have long shown that, for a wide range of tasks, human engagement drops significantly when the response time of the interaction exceeds 2 seconds. The good news is that there are ways to mitigate this problem, so read on!

How to speed up Looker dashboards

In this post, I’ll first talk about two common approaches, and then present a new but more automated and, I believe, more effective approach to improve dashboard performance.

Reduce the number of tiles on each dashboard

This “breaks up” the latency into smaller chunks to improve dashboard speed. For example, instead of a single dashboard that takes 60 seconds to load, break it into two dashboards that can each load in 30 seconds. The speed-up may not always be linear like that, but you get the idea.

This is easy to do. You don’t have to optimize your queries or tweak your schema. However, this method is not ideal for information-rich dashboards. At some point, the dashboard loses its value if you keep breaking it up. Also, this doesn’t help for the tiles that are inherently slow, running a query that is too expensive even when run by itself.

Manual performance optimization and PDTs

You can manually analyze the SQL queries behind your slow dashboard and experiment with different ideas, like changing column types, adding an index, or looking at the query plan (by running EXPLAIN). If you are using Snowflake with Looker, we list several query mistakes we see often. You can also materialize common subqueries, either in your ETL pipeline or by using Looker’s PDTs (Persistent Derived Tables).

These manual optimizations, especially PDTs, actually speed-up your slow queries dramatically instead of scattering them across multiple dashboards. In addition, you can keep your data-rich dashboard, with all relevant KPIs shown together. But there are 3 major barriers to effective manual optimization that can put you on a treadmill of sorts:

  • It can be daunting to analyze tens or hundreds of SQL queries across different dashboards and decide what to pre-aggregate or pre-join in order to achieve the highest speedup. You may end up materializing a view that gets updated too frequently or end up with too many pre-aggregated/pre-joined tables that are too expensive to update.
  • You have to ensure that all your dashboards use those aggregated views or PDTs instead of the base tables, and do so correctly.
  • It is time-consuming. New data sources get added, schemas change, and new dashboards get created, so revisions are constantly needed. With this approach, you’re never going to be “done.” Many data teams are surprised when they measure how much of their time is spent on performance optimization and preventing performance problems.

Automated performance optimization using Keebo’s Data Learning

There is a third, automated approach to solving database performance problems. Starting in 2014, my Ph.D. students and I have been researching the use of machine learning to accelerate and automate analytical workloads. This area, which we call Data Learning, has seen several breakthroughs. After seeing several successful deployments, we decided to commercialize this idea in 2019 as a system we call Keebo.

Using Keebo AI to accelerate Looker queries

Data teams have since used Keebo to dramatically improve their user experience and query performance. Keebo’s automated Data Learning can speed up Looker dashboards without requiring you to write a single line of code or make any changes to the database. Keebo transparently inserts itself between your BI layer and your data warehouse to automatically accelerate queries.

Bi to Warehouse Animation gray background

Setting up Keebo

Looker connects to Keebo in the same way it would connect directly to the underlying database. No custom driver or special configuration required: connecting/disconnecting Keebo is as simple as changing the hostname in your connection setting. On the Looker side, just change your connection’s hostname to Keebo. It’s that easy. Any dashboard using this connection automatically accelerates.

Looker connection settings

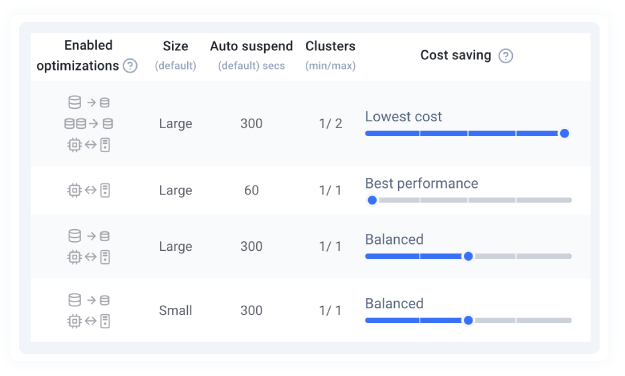
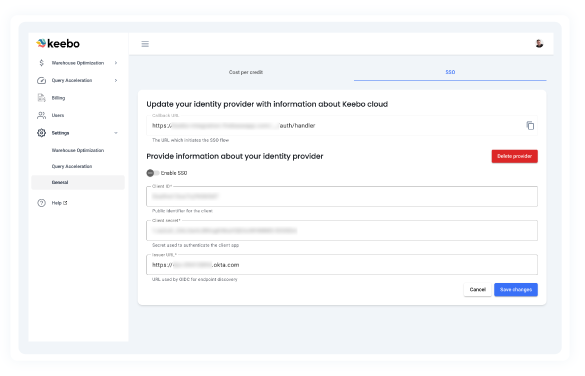
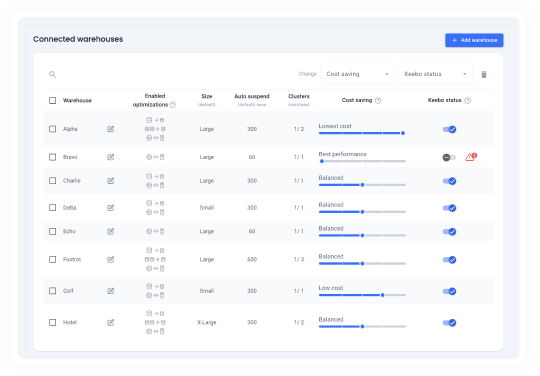
On the Keebo side (which is a SaaS solution), you can set various parameters for acceleration, like data freshness and even a budget for acceleration.

QA controls no border

How Keebo works

Once Keebo connects to your data warehouse, it automatically starts to learn a set of “smart models” by analyzing your queries and data. Keebo stores its smart models in your own data warehouse for security and efficiency. At run time, when your dashboards load or issue queries to your database, Keebo analyzes those queries. If it identifies slow queries, Keebo automatically rewrites them into an equivalent form using its smart models before routing them to your data warehouse. This means your computation and data remain inside your data warehouse.

Smart models are significantly more compact than the raw data in your base tables and they avoid expensive computations (joins, aggregation, filtering). This means that your database can run Keebo’s rewritten query up to 100x faster than the original query.

Keebo’s automated process, called Data Learning, takes three factors into account when deciding which smart models to build:

  1. Your data distribution, considering factors such as high cardinality and skewed columns or large tables.
  2. Your query distribution, such as common join patterns, grouping conditions, filter columns, and aggregation patterns.
  3. Your storage budget. Keebo automatically learns an optimal set of smart models that will speed up the largest number of slow query patterns while staying within your storage budget.
query rewrite no shadow

Whenever the underlying data or the schema changes, Keebo automatically updates its smart models too. Keebo continuously monitors for new query patterns and their frequency of occurrence, creating new models or retiring older ones when they’re no longer useful.

Keebo advantages

  • Similar to Machine Learning, Data Learning is a general approach that can analyze millions of past queries, whereas human experts may get overwhelmed and make suboptimal decisions.
  • This fully-automated approach typically delivers up to 100x speedups.
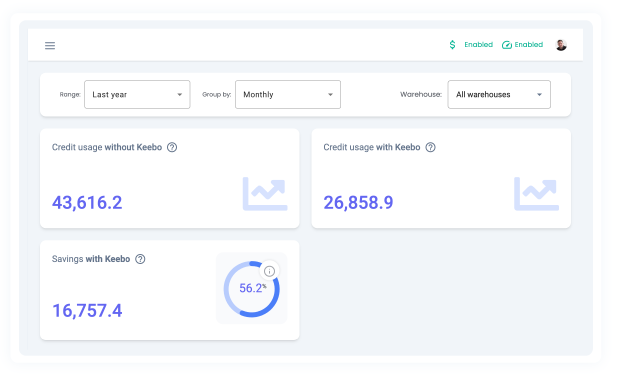
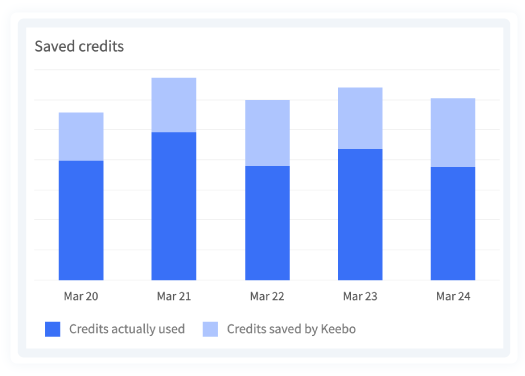
  • Because your queries need less compute power, you can considerably reduce your compute bill as well, and potentially even downsize your cloud data warehouse.
  • It saves you the time needed for diagnosing and fixing performance problems. Unlike typical machine learning, which is often block-box, with Data Learning you can look at the rewritten queries to examine what’s going on underneath.
  • Anyone using a Keebo connection will automatically benefit from the speedups without a need to understand the underlying changes.
  • Queries are rewritten on-the-fly, so the queries in your dashboard remain in their original, straightforward forms which can be easily debugged and modified.
  • You don’t need to worry about your materialized views or ETL pipeline. Keebo detects schema and data changes automatically, and then updates its own models accordingly.
  • Whenever new queries are issued or new dashboards are created, Keebo automatically adjusts its models.
  • Keebo resides behind your firewall and your models and data remain secure inside your data warehouse. You also don’t need a large server to host Keebo because queries are still run by your own database.

Letting AI do the work to accelerate Looker

There are things that only humans can do, but more and more, we’re finding that some things we thought required human expertise can actually be automated. Advances in Data Learning show that performance-related optimizations, database tuning and writing/maintaining complex data aggregation pipelines can and should now be delegated to automated systems. Data teams can instead spend their precious time on more important tasks that directly impact business results, like ensuring data quality or deriving actionable insights. That’s what Keebo is here for: Our mission is automating and accelerating enterprise analytics using Data Learning. You can learn more about Keebo’s Query Acceleration here, or request a free trial or demo here.

Barzan Mozafari
Barzan Mozafari
Articles: 4